 Get premium membership
 and access revision papers with marking schemes, video lessons and live classes.
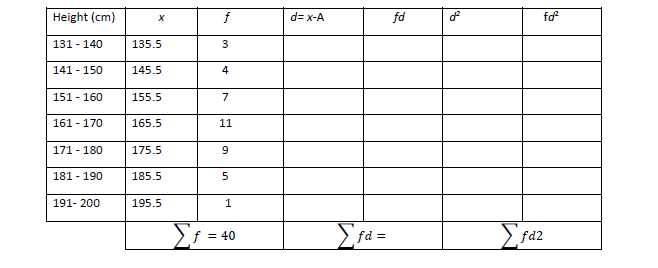
The data below represents the heights, taken to the nearest centimeter, of 40 orange trees in a garden.
(Assumed mean A=165.5 and m = calculated mean)

(a) Complete the table
(b) Using the method of assumed mean, calculate the mean height.
(c) Calculate the standard deviation of the distribution.